
When vetting a new digital marketing scope, it’s common practice for us to always start by conducting research. It’s one thing to sit down and identify what the goals and objectives are of a campaign. It’s another to identify and develop personas of existing consumers in order to target a likely-to-convert audience. When faced with a scope specific to the tourism industry, we want to focus on understanding those who are currently paying to travel and visit specific destinations. This understanding of existing consumers can help expand into uncovering new markets of opportunity based on similar behavior and demographics.
So how can one uncover and support these markets with data? You analyze data sources you have access to, draw insights from existing audiences and develop strategies geared towards reaching these personas.
Don’t Sleep on Descriptive Statistics

First things first – let’s look at the basics of data analysis. If you’ve ever taken a statistics course, there’s a good chance that you are familiar with what descriptive statistics are. If it’s been a hot minute, then here’s a quick rundown on what exactly descriptive statistics are.
As the name implies, a descriptive statistic is a single term that quantitatively describes, or summarizes, a piece of data. The plural form of descriptive statistics refers to the process of analyzing those statistics to learn about a sample of data. The most common descriptive statistics derived from raw data include: mean, median, mode, count and standard deviation.
When it comes to analyzing data, using descriptive statistics can really help paint a quick picture of the sample data. For example, say we have a data set on the demographics of those who have worked with a US tourism agency in the past five years. By getting descriptive statistics of certain fields, such as age or gender, we can see quickly what characteristics stand out and whether they appear to be a population more susceptible to using tourism agency services.
Where to Find Data Sources

Next, how do we find the right data sources? If you have access to your agency’s database, then great! You’re ready to dive into the data through a program of your choice.
If you don’t have access to internal data, then this next step may be a bit of a challenge. Depending on the industry, this can be either a very easy or a very difficult thing to accomplish. Data privacy is a concern that everyone is invested in and isn’t always available to the public, which can make it hard to find raw information on the industry.
Thankfully, a lot of industries already do the work for you and often release reports that are available for the public to peruse. Statista is a great source for data across a number of industries, including tourism in the United States. These reports can get you started on the right path of identifying audiences in the industry.
Other sources for public data sets include:
- Census data. This can be a great place to start if you’re researching opportunities within the United States population.
- US Government data. Covering a wide range of industries, this website contains a ton of data to analyze.
Use Your Digital Sources: Paid Search + Social Media
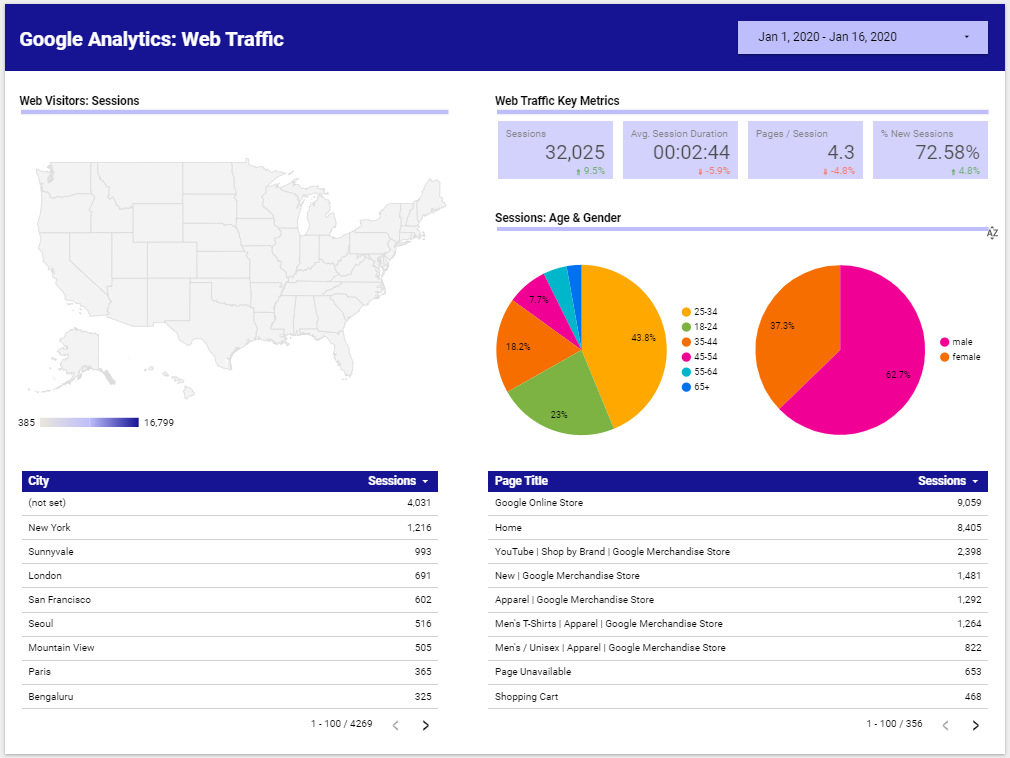
If you are using Google Analytics on your website, then you already have access to a valuable pool of data. Ranging from information on the audience of web visitors to specific actions taken on web pages, the amount of insights you can draw from this data source is incredible. If linked correctly, Analytics can help you dive further into your Google Ads campaign data. This allows you to understand where and how web visitors are being driven to your website.
The amount of data available in Analytics can quickly have you lose track of time going through each tab on the sidebar. To avoid getting overwhelmed, we prefer to connect this source with a data visualization tool, such as Google Data Studio or Tableau. These types of tools provide a better overview and allow for quick analysis.
Another valuable source of data falls under the realm of social media. If you have a Facebook or Instagram business account for your organization, then you have access to Insights. In the platform itself, you have the ability to browse data about your followers. From this source, you can see how your followers engage with your page, followers’ reactions to posts, where they are from, and more. As with Analytics data, you can take this data one step further and connect it with a data visualization tool.

Data Visualization
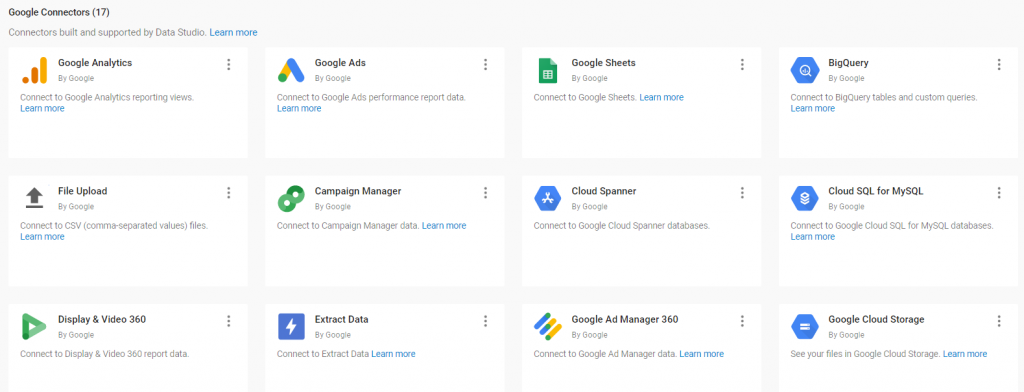
Considering that our agency uses Google Suite programs, it’s no surprise that Google Data Studio is our data viz tool of choice. What’s great about Data Studio is its ability to seamlessly connect with a number of internal and external sources of data and blend sources painlessly.
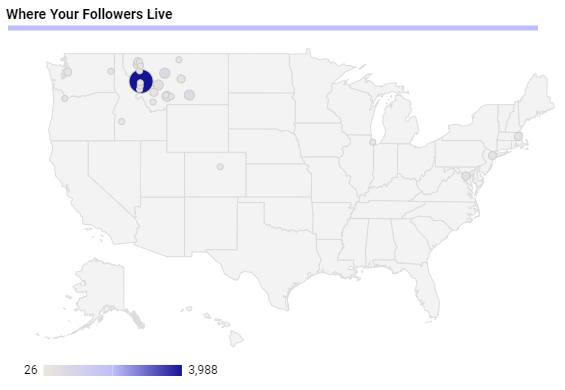
With this tool, you can build visually appealing and insightful reports that can answer questions about your existing audience quickly. Consider the following image. We can quickly see a snapshot of where our followers are, thus prompting us to consider expanding our efforts to these markets.
Still not convinced? Try for yourself using one of our simple web traffic report templates.
Step 1. Go to this template report .
Step 2. Click on the Duplicate icon on the top right and on the pop up, select Copy Report.

Step 3. Select any graph and under the Data tab on the right side panel, click on the [Sample] Google Analytics data source, and click on the Create New Data Source at the bottom to connect to your Analytics data.